


Wattnet background pattern

About Wattnet

Who's behind Wattnet, how it measures the environmental footprint of European electricity, and the team building it.

What It Achieves

Making Electricity's Footprint Visible

Wattnet turns raw grid data into a clear, comparable footprint figure for every zone in Europe, real-time, historical, and forecasted, so researchers, policymakers, and anyone curious can see exactly what's behind the electricity they use.

Follow a single unit of electricity, from where it's made to where it's used:

01

It starts at the source

A wind farm, a hydro dam, a gas plant, somewhere in Europe. Every source leaves a different mark on the grid, and on the planet.

02

It rarely stays put

Electricity crosses borders within milliseconds. Wattnet's flow-tracing follows it, tying every import and export back to where it came from.

03

It arrives with a footprint

By the time it reaches a socket, hundreds of kilometers away, its carbon and water footprint has traveled with it. That's the number Wattnet shows you.

Developed by IFCA (CSIC · University of Cantabria) within the GreenDIGIT project, funded by the EU's Horizon Europe programme and the Swiss SERI.

The Pipeline

From Raw Grid Data to a Footprint Number

Turning raw electricity data into a trustworthy footprint figure takes more than one step. Here's what happens behind the scenes, several times an hour, for every zone Wattnet covers.

01

Collect

Generation, demand, and cross-border flow data is pulled continuously from European grid operators, including ENTSO-E, Elexon, and EPIAS.

02

Clean

Raw grid data isn't perfect: readings can be missing, delayed, or clearly wrong. Outliers are detected and gaps estimated before any number is published.

03

Compute

Flow-tracing attributes each zone's electricity, and its footprint, back to where it was actually generated, accounting for imports and exports.

04

Forecast

The same pipeline feeds a 72-hour forecasting model, so a zone's footprint can be anticipated, not just tracked after the fact.

Under the Hood

What the Figures Actually Represent

Not every footprint number is calculated the same way. Two zones with identical generation mixes can end up with different figures once trade, sourcing, and life-cycle scope are taken into account.

60

Zones
Covered

15 min

Temporal
Resolution

72h

Forecast
Horizon

4

Environmental
Indicators

What We Measure

  • Four core indicators per zone: carbon footprint, water footprint, water impact, and an overall environmental score.
  • Local (generation-based) and global (consumption-based, trade-adjusted) footprints, calculated side by side.
  • Reported at the most granular level available, usually a bidding zone or control area, since country-wide averages can hide real differences between regions.

How We Calculate It

  • Emission and water-use factors sourced from recognized bodies like the IPCC and UNECE, not estimated in-house.
  • Both operational and life-cycle impact are counted, from daily running to manufacturing and decommissioning.
  • Built on the same flow-tracing pipeline described above, refreshed continuously as new grid data arrives.
Who We Are

The Team Behind Wattnet

Wattnet is built and maintained by a small team at IFCA in Santander, spanning software engineering, environmental data modeling, and predictive analytics, all part of the Advanced Computing and e-Science Group.
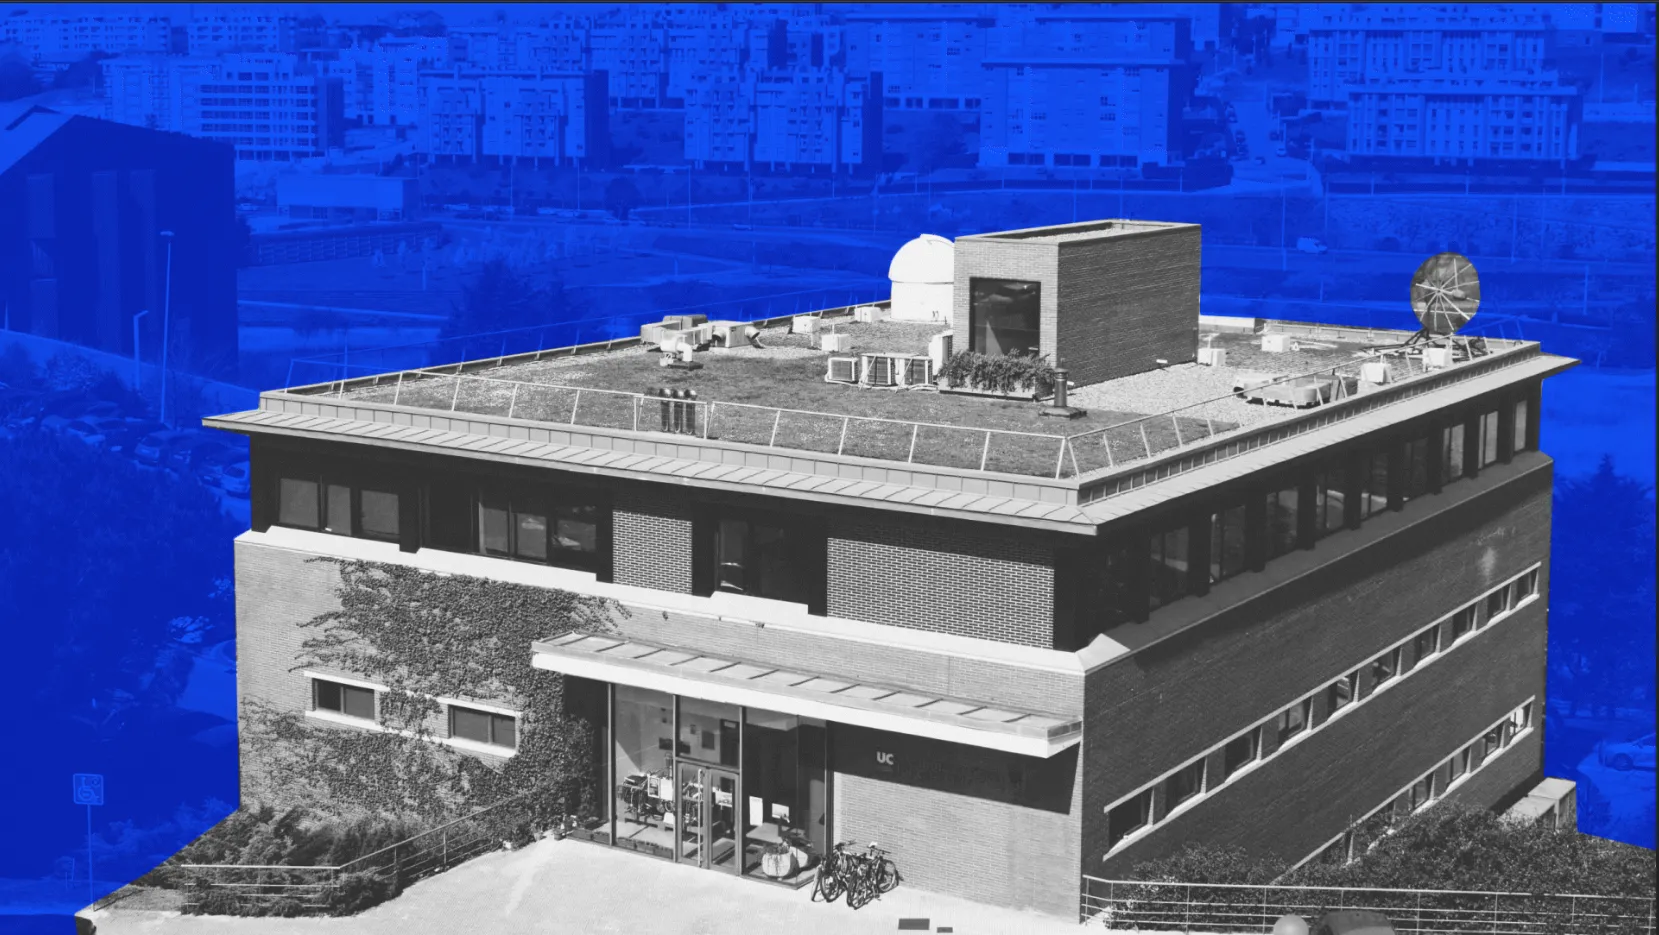
The Institute of Physics of Cantabria (IFCA), where Wattnet is developed

The team works out of IFCA, in Santander

Jaime Iglesias BlancoORCID icon

Lead Backend Developer & Service Maintainer

iglesias@ifca.es

María Castrillo MelguizoORCID icon

Environmental Data Modeling Expert

castrillo@ifca.es

Álvaro López GarcíaORCID icon

Technical Supervisor & Business Strategy

aloga@ifca.es

Marta Obregón RuizORCID icon

Frontend Developer & UX/UI Designer

obregonm@ifca.es

Judith Sáinz-Pardo DíazORCID icon

Predictive Modeling & Estimation Data Scientist

sainzpardo@ifca.es
Open By Design

Built in the Open

The parts of the platform that are open source live on GitHub under the Apache 2.0 license, free to inspect, reuse, and build on. Access to the data itself isn't released under a separate open license; it's governed by our terms of service.

See Wattnet in action

Explore the live dashboard and start tracking the carbon and water footprint of electricity across Europe.

Get Started Now