Next-Level Services
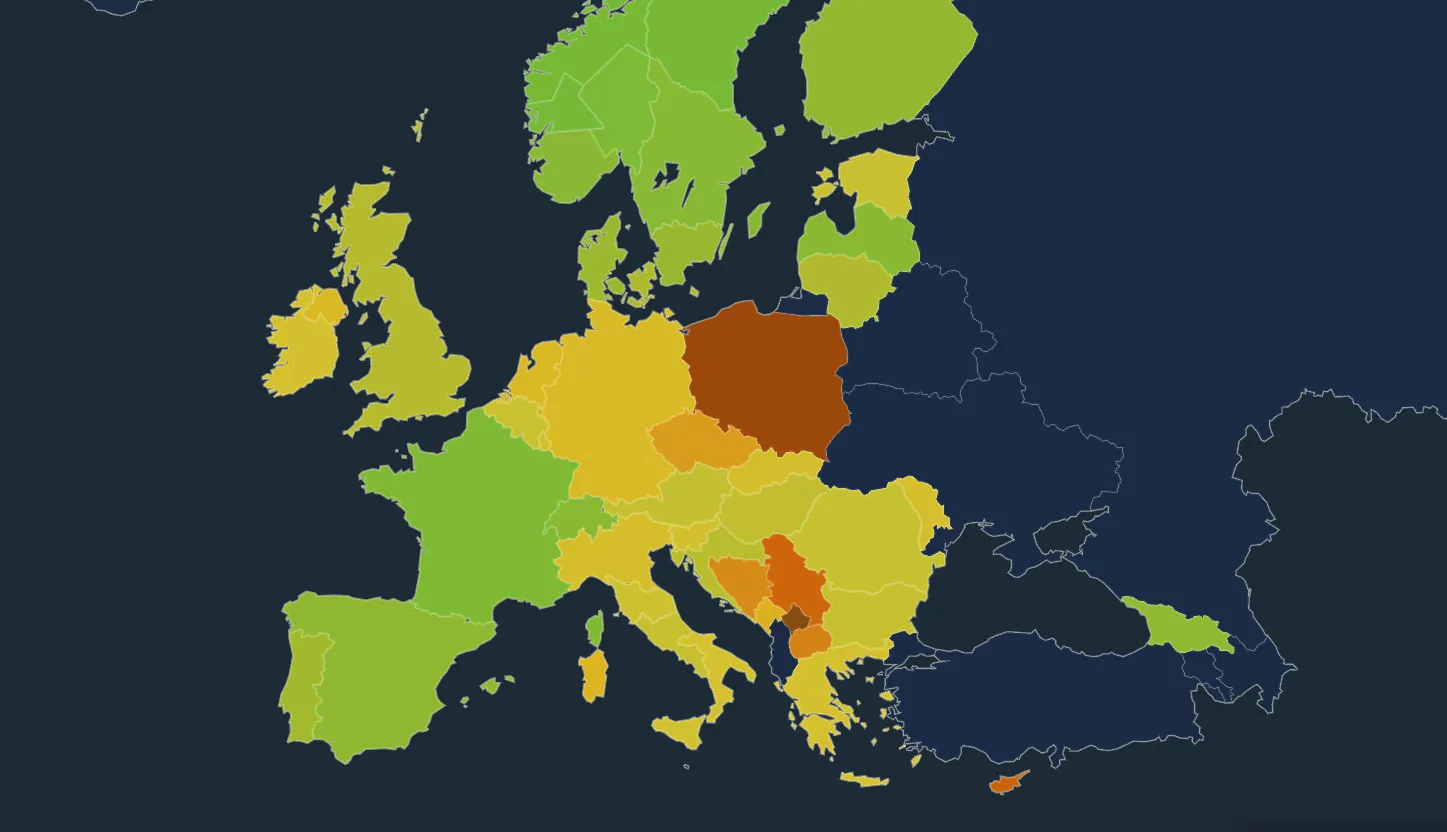
Visualize All Metrics at a Glance
The dashboard lets you explore all key metrics: electricity generation by type, cross-zone electricity exchanges, carbon and water footprints, and more.
All in a clear, interactive, and visually engaging interface.
🚧
wattnet dashboard is under development
Soon you'll explore all energy data and environmental footprints in one place.
Build Custom Integrations
Our API allows seamless integration of wattnet into your workflow. Create dashboards, analyze footprints, and extend functionality with ease.
RESTful API with comprehensive endpoints
Complete OpenAPI Specification (OAS 3.1)
Secure authentication with OAuth 2.0
curl -X GET "https://api.wattnet.eu/v1/footprints?\ lat=43.4717&lon=-3.8024&footprint_type=carbon&\ start=2025-09-01T01%3A02%3A03Z&end=2025-09-01T04%3A05%3A06Z&\ aggregate=true" \ -H "Authorization: Bearer YOUR_API_KEY" \ -H "Content-Type: application/json"
[
  {
  "footprint_type": "carbon",
  "scope": "life-cycle",
  "zone": "ES",
  "unit": "gCO2/kWh",
  "coverage": "global",
  "start": "2025-09-01T01:02:03Z",
  "end": "2025-09-01T04:05:06Z",
  "value": 91.96293340125035,
  "valid": true,
  "zone_status": "complete",
  "aggregation_method": "time-weighted-average"
  }
]
 Ready-to-use, High-Quality Data Collections
Explore curated datasets covering energy generation, cross-border exchanges, and environmental footprints for research and analysis.
Ready to explore all energy insights?
Everything you need to track electricity generation, cross-zone flows, and environmental footprints.